Introduction
The XRP sell signals TD Sequential indicator has become a critical tool for traders seeking to identify potential turning points in Ripple’s price action. Developed by Tom DeMark, this indicator is known for spotting trend exhaustion—moments when a strong bullish or bearish run may be nearing its end. For XRP, which has seen sharp price fluctuations and strong speculative rallies, understanding TD Sequential signals can provide valuable insights into when to take profit or prepare for a market reversal.
In this article, we’ll break down how the TD Sequential works, how sell signals are generated, what recent XRP signals are showing, and how traders can effectively use this indicator in combination with other tools to improve accuracy.
Understanding the TD Sequential Indicator
What Is the TD Sequential?
The TD Sequential is a technical analysis indicator created by renowned analyst Tom DeMark. It is designed to identify potential trend exhaustion points by analyzing price patterns over a sequence of bars or candles. The concept behind it is simple—every trend has a life cycle, and by tracking the momentum and counting patterns, traders can anticipate when that cycle might end.
How the Indicator Counts
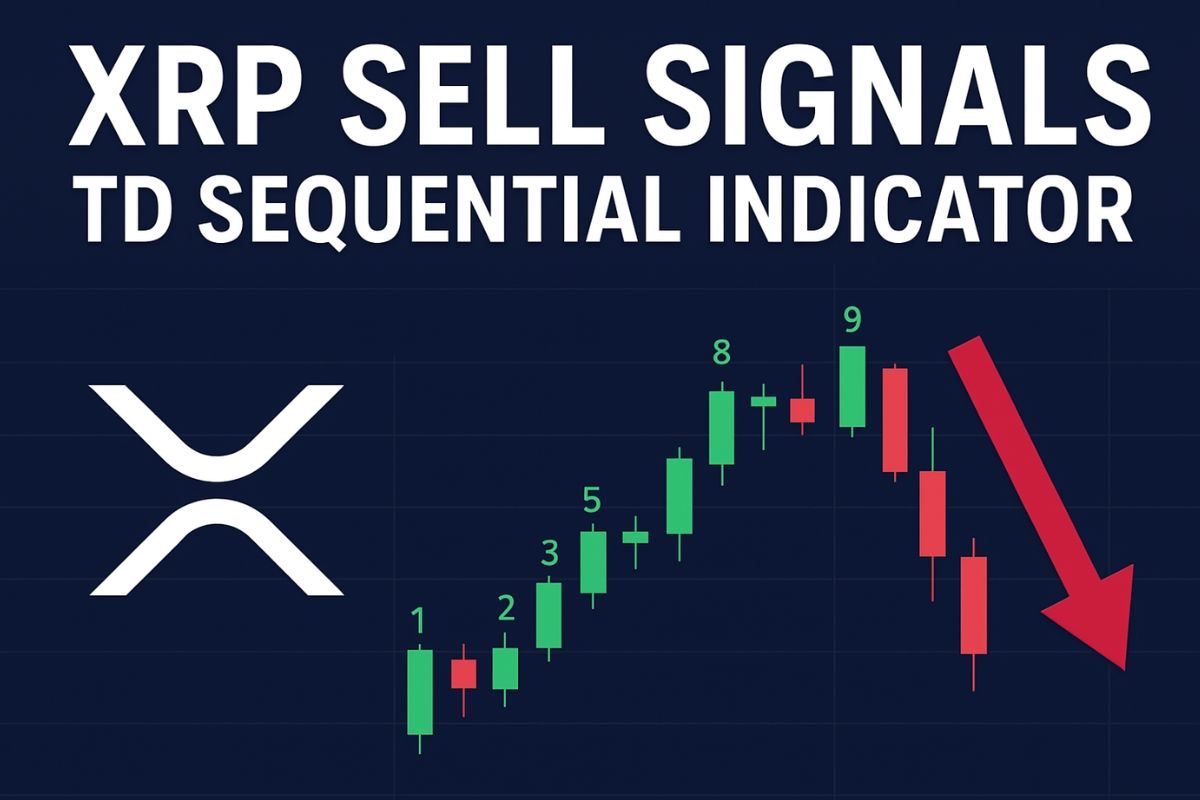
In a bullish trend, the TD Sequential counts up from 1 to 9, and sometimes continues to 13, based on specific rules. A “count” begins when a bar closes higher than the close of four bars earlier. If this pattern continues for nine consecutive bars, it signals that buying pressure may be fading.
When this nine-bar sequence is completed, it often marks a potential sell signal, warning that the market could be overextended and due for a correction.
How Sell Signals Work
A sell signal in the TD Sequential appears when:
-
There are nine consecutive price bars closing higher than the high four bars earlier.
-
The price has shown strong upward momentum, but begins to lose strength.
-
Traders see overbought conditions or bearish divergence in other indicators.
This signal doesn’t mean the price will instantly fall—it means the probability of a pullback increases significantly. Smart traders wait for confirmation from volume decline, candlestick patterns, or support breaks before acting on it.
XRP and the TD Sequential Indicator
Why Traders Use It for XRP
XRP is known for high volatility and sudden market shifts, making it a perfect candidate for the TD Sequential indicator. Since XRP often experiences quick rallies followed by sharp corrections, recognizing a “9 count” can help traders avoid entering near market tops or can guide them to lock in profits before a downturn.
Historical Accuracy
Over the past few years, the TD Sequential indicator has shown reliable accuracy in identifying XRP’s major turning points. When XRP hit significant highs, a TD Sequential sell signal often appeared shortly before corrections took place. Analysts have noted that both the 3-day and 2-week charts have historically provided strong signals for XRP, especially during periods of market euphoria.
Recent Sell Signal Observations
Recently, technical analysts observed that XRP printed TD Sequential sell signals on several key timeframes:
-
A 3-day chart sell signal appeared near a local top, indicating momentum loss.
-
A 4-hour chart also showed short-term exhaustion, warning of a possible retracement.
-
On the 2-week timeframe, a bearish setup signaled that long-term resistance zones could trigger extended corrections.
These signals have led traders to watch closely for potential reversals or consolidation phases.
How to Interpret XRP Sell Signals
Not Every Signal Is Final
The first rule of using the TD Sequential is to avoid treating it as a stand-alone system. While the 9-count pattern is powerful, it does not always produce immediate results. XRP can continue to rise for a few more sessions before reversing. Therefore, experienced traders combine it with:
-
Volume analysis to spot declining buying pressure.
-
Support and resistance levels to identify exit points.
-
RSI and MACD indicators for confirmation of momentum loss.
Multi-Timeframe Confirmation
To increase reliability, traders often compare multiple timeframes. For example:
-
If both the 4-hour and daily charts show a TD Sequential sell signal, the probability of reversal strengthens.
-
If only one timeframe shows a signal, it may represent a short-term pause rather than a trend reversal.
Ideal Trading Strategy
-
Identify a completed 9-count on your preferred timeframe.
-
Watch for bearish candlestick confirmation (e.g., engulfing candle, doji, or shooting star).
-
Confirm with declining volume or momentum divergence.
-
Place a stop-loss above the recent high to limit risk.
-
Manage your position and re-evaluate if new bullish signals appear.
Common Mistakes When Using TD Sequential
Acting Too Early
Many traders react as soon as the 9-count appears.”Reacting to the 9-count immediately can force you out of positions too soon, causing you to miss any continued upside.” Patience is crucial; wait for price confirmation before selling or shorting.
Ignoring Market Context
Even when a sell signal appears, macroeconomic news, regulatory developments, or whale accumulation can override technical setups. For XRP, legal or fundamental news can drastically shift sentiment.
Failing to Combine with Other Tools
The TD Sequential works best when blended with broader technical frameworks, such as Fibonacci retracement, trendlines, or moving averages. For example, if a TD sell signal coincides with resistance near a 61.8% Fibonacci level, the signal’s reliability increases.
Advantages of TD Sequential for XRP Traders
-
Objective Pattern Recognition: It provides clear, rule-based entries and exits.
-
Works Across Timeframes: Whether you trade short-term or long-term, the Sequential adapts.
-
Identifies Overextended Moves: Helps spot points of exhaustion before the trend reverses.
-
Effective in Volatile Assets: Particularly useful for assets like XRP that experience sharp swings.
Limitations to Consider
-
Lagging Nature: The indicator reacts to completed price action, so it may signal slightly late.
-
False Signals in Strong Trends: In powerful rallies, XRP can continue to climb even after a 9-count sell signal.
-
No Fundamental Awareness: The TD Sequential doesn’t consider news, partnerships, or adoption trends.
That’s why professional traders always treat it as a supporting signal, not the sole decision-maker.
The Broader Market Implications
As of recent analysis, the presence of multiple TD Sequential sell signals on XRP suggests that the market may be entering a corrective phase after a period of strong bullish momentum. This does not necessarily signal the start of a bear market, but rather a healthy reset that could lead to new buying opportunities once selling pressure stabilizes.
Investors watching the XRP chart should remain alert for signs of support confirmation around major price zones. If the correction deepens but holds above key levels, the overall bullish structure could remain intact.
Conclusion
The XRP sell signals TD Sequential indicator continues to serve as one of the most respected tools for timing market exhaustion and predicting short-term corrections. While it cannot predict exact tops or bottoms, it provides valuable insight into when market momentum may be fading.
For XRP traders, understanding how to read and interpret these signals is essential to managing risk and improving trade timing. The key lies in combining TD Sequential insights with broader technical and fundamental analysis, maintaining discipline, and waiting for confirmation before acting.
In a volatile market like crypto, knowledge and patience remain the most powerful trading tools—just as important as any indicator.
https://cryptotodaynews.site/